

Spotify Annual Report 2017

Displayed above is a wireframe for an annual report, prototyped with Adobe XD. This was a project with the purpose of making a dynamic and interactive wireframe to bring creativity to a document that is usually filled with crucial information with limited visuals.

I choose Spotify, as I think that music is an integral part of a lot of people’s lives, including mine. Therefore, Spotify being my favorite source of listening to any music, I decided to create a beneficial and visually engaging prototype for their 2017 annual report.

Spring 2019

Screens
The opening screen: the Spotify mark centred small on near-black
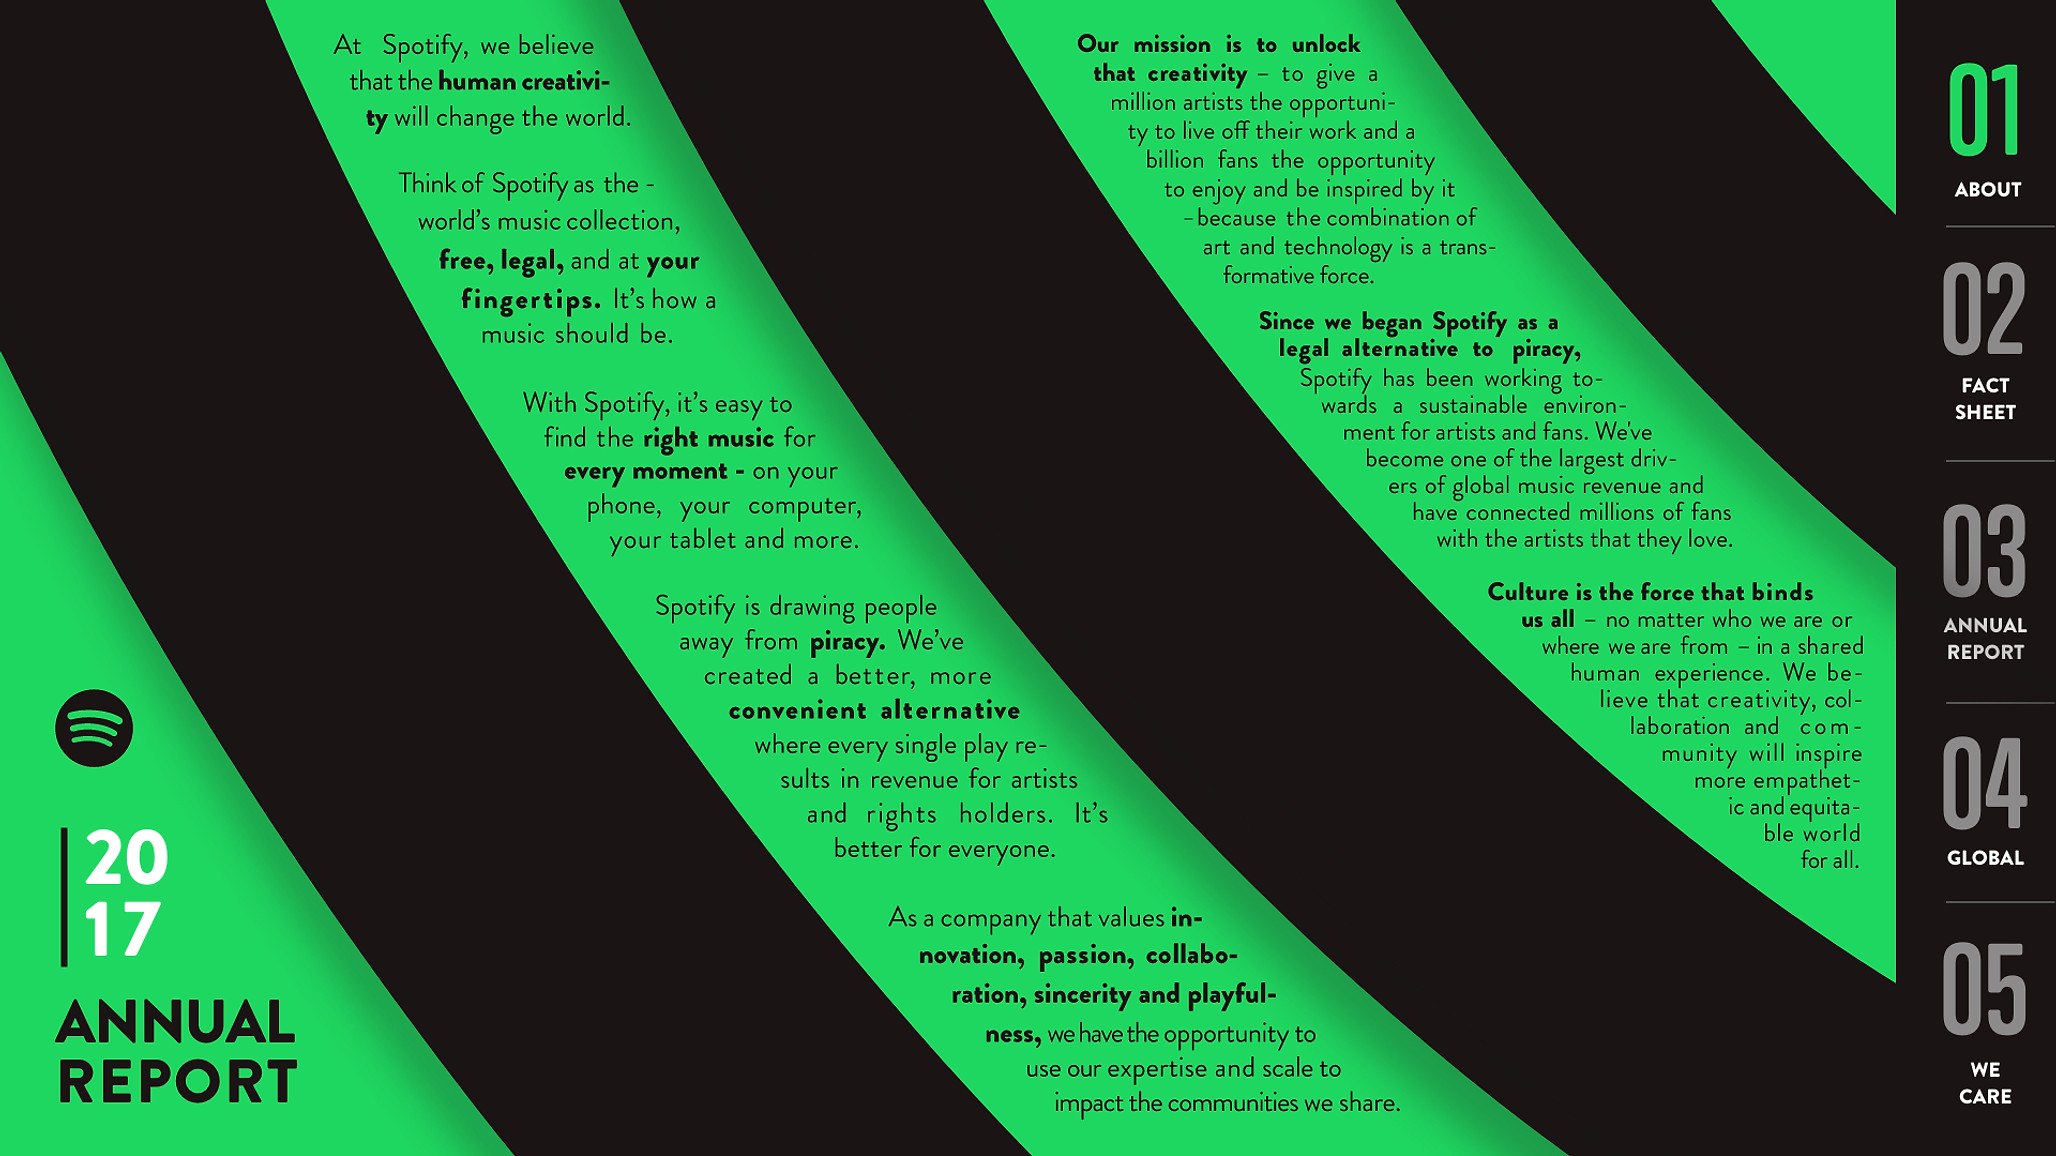
The cover: “2017 ANNUAL REPORT” in the lower left on black, with wide green arcs sweeping across the page and a column of mission copy set in narrow measures
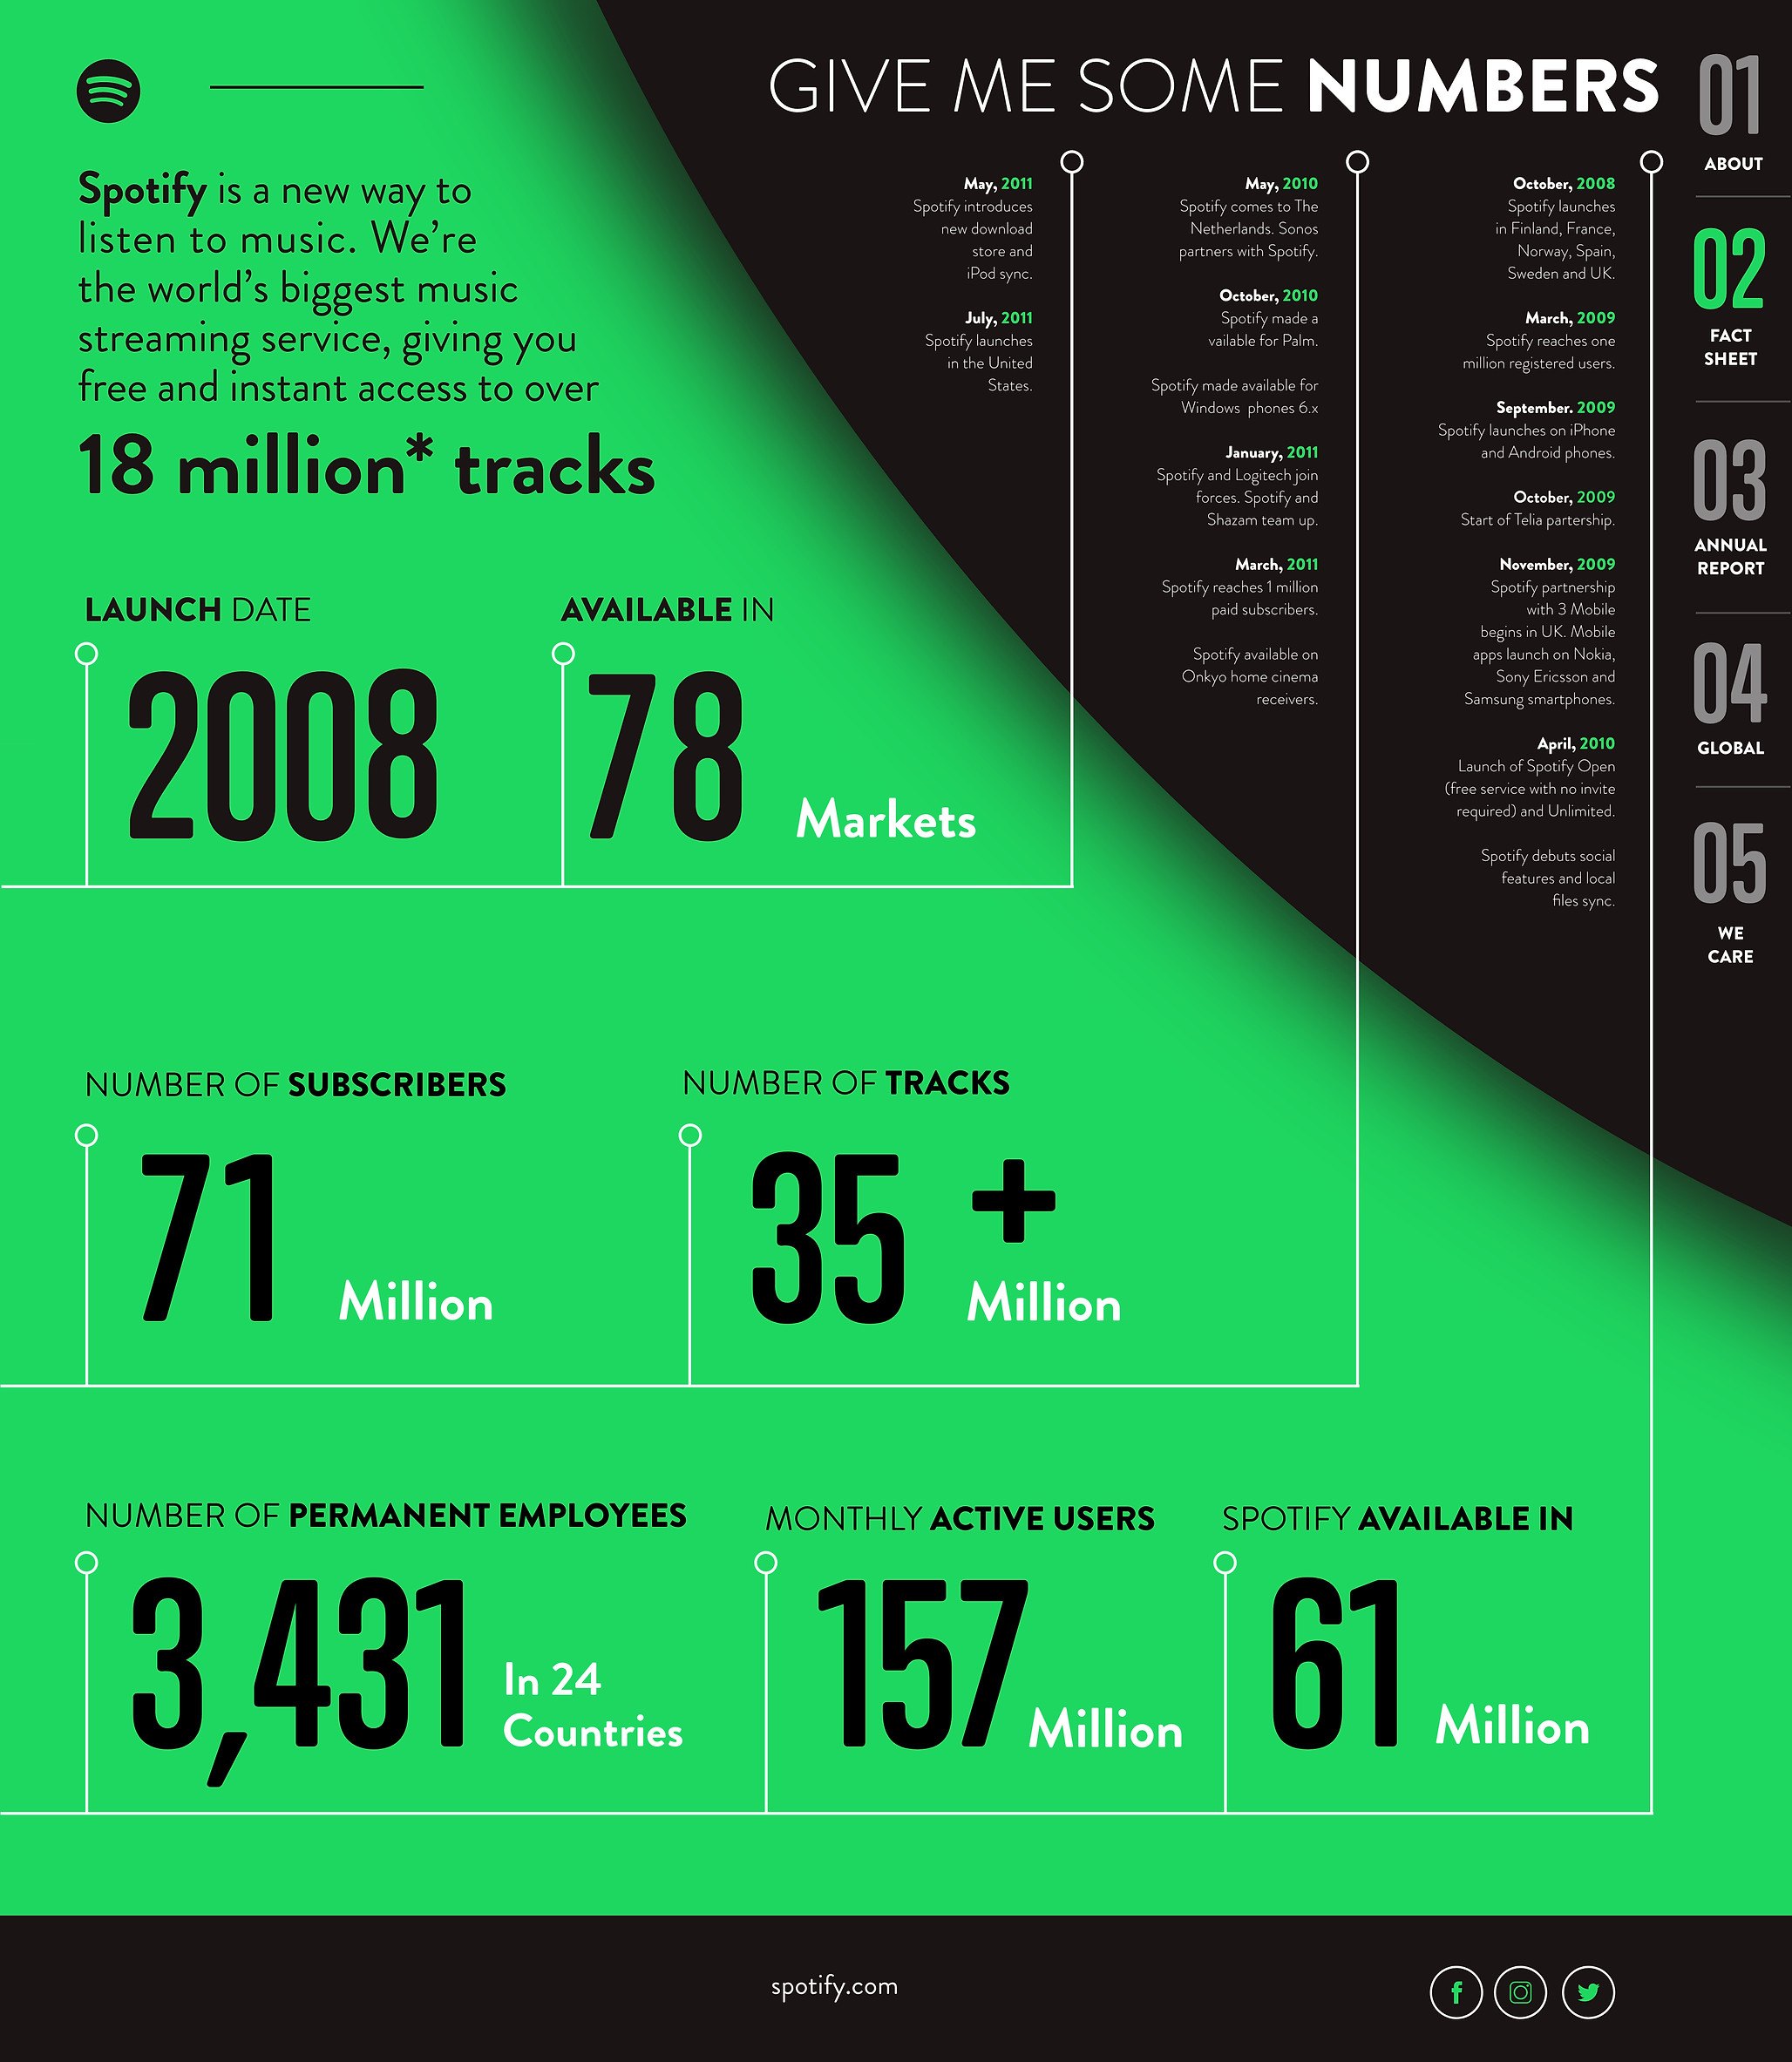
“Give me some numbers”: the launch date 2008, 78 markets, 71 million subscribers, 35 million tracks and 3,431 employees set as very large figures on flat green, with a milestone timeline down the right
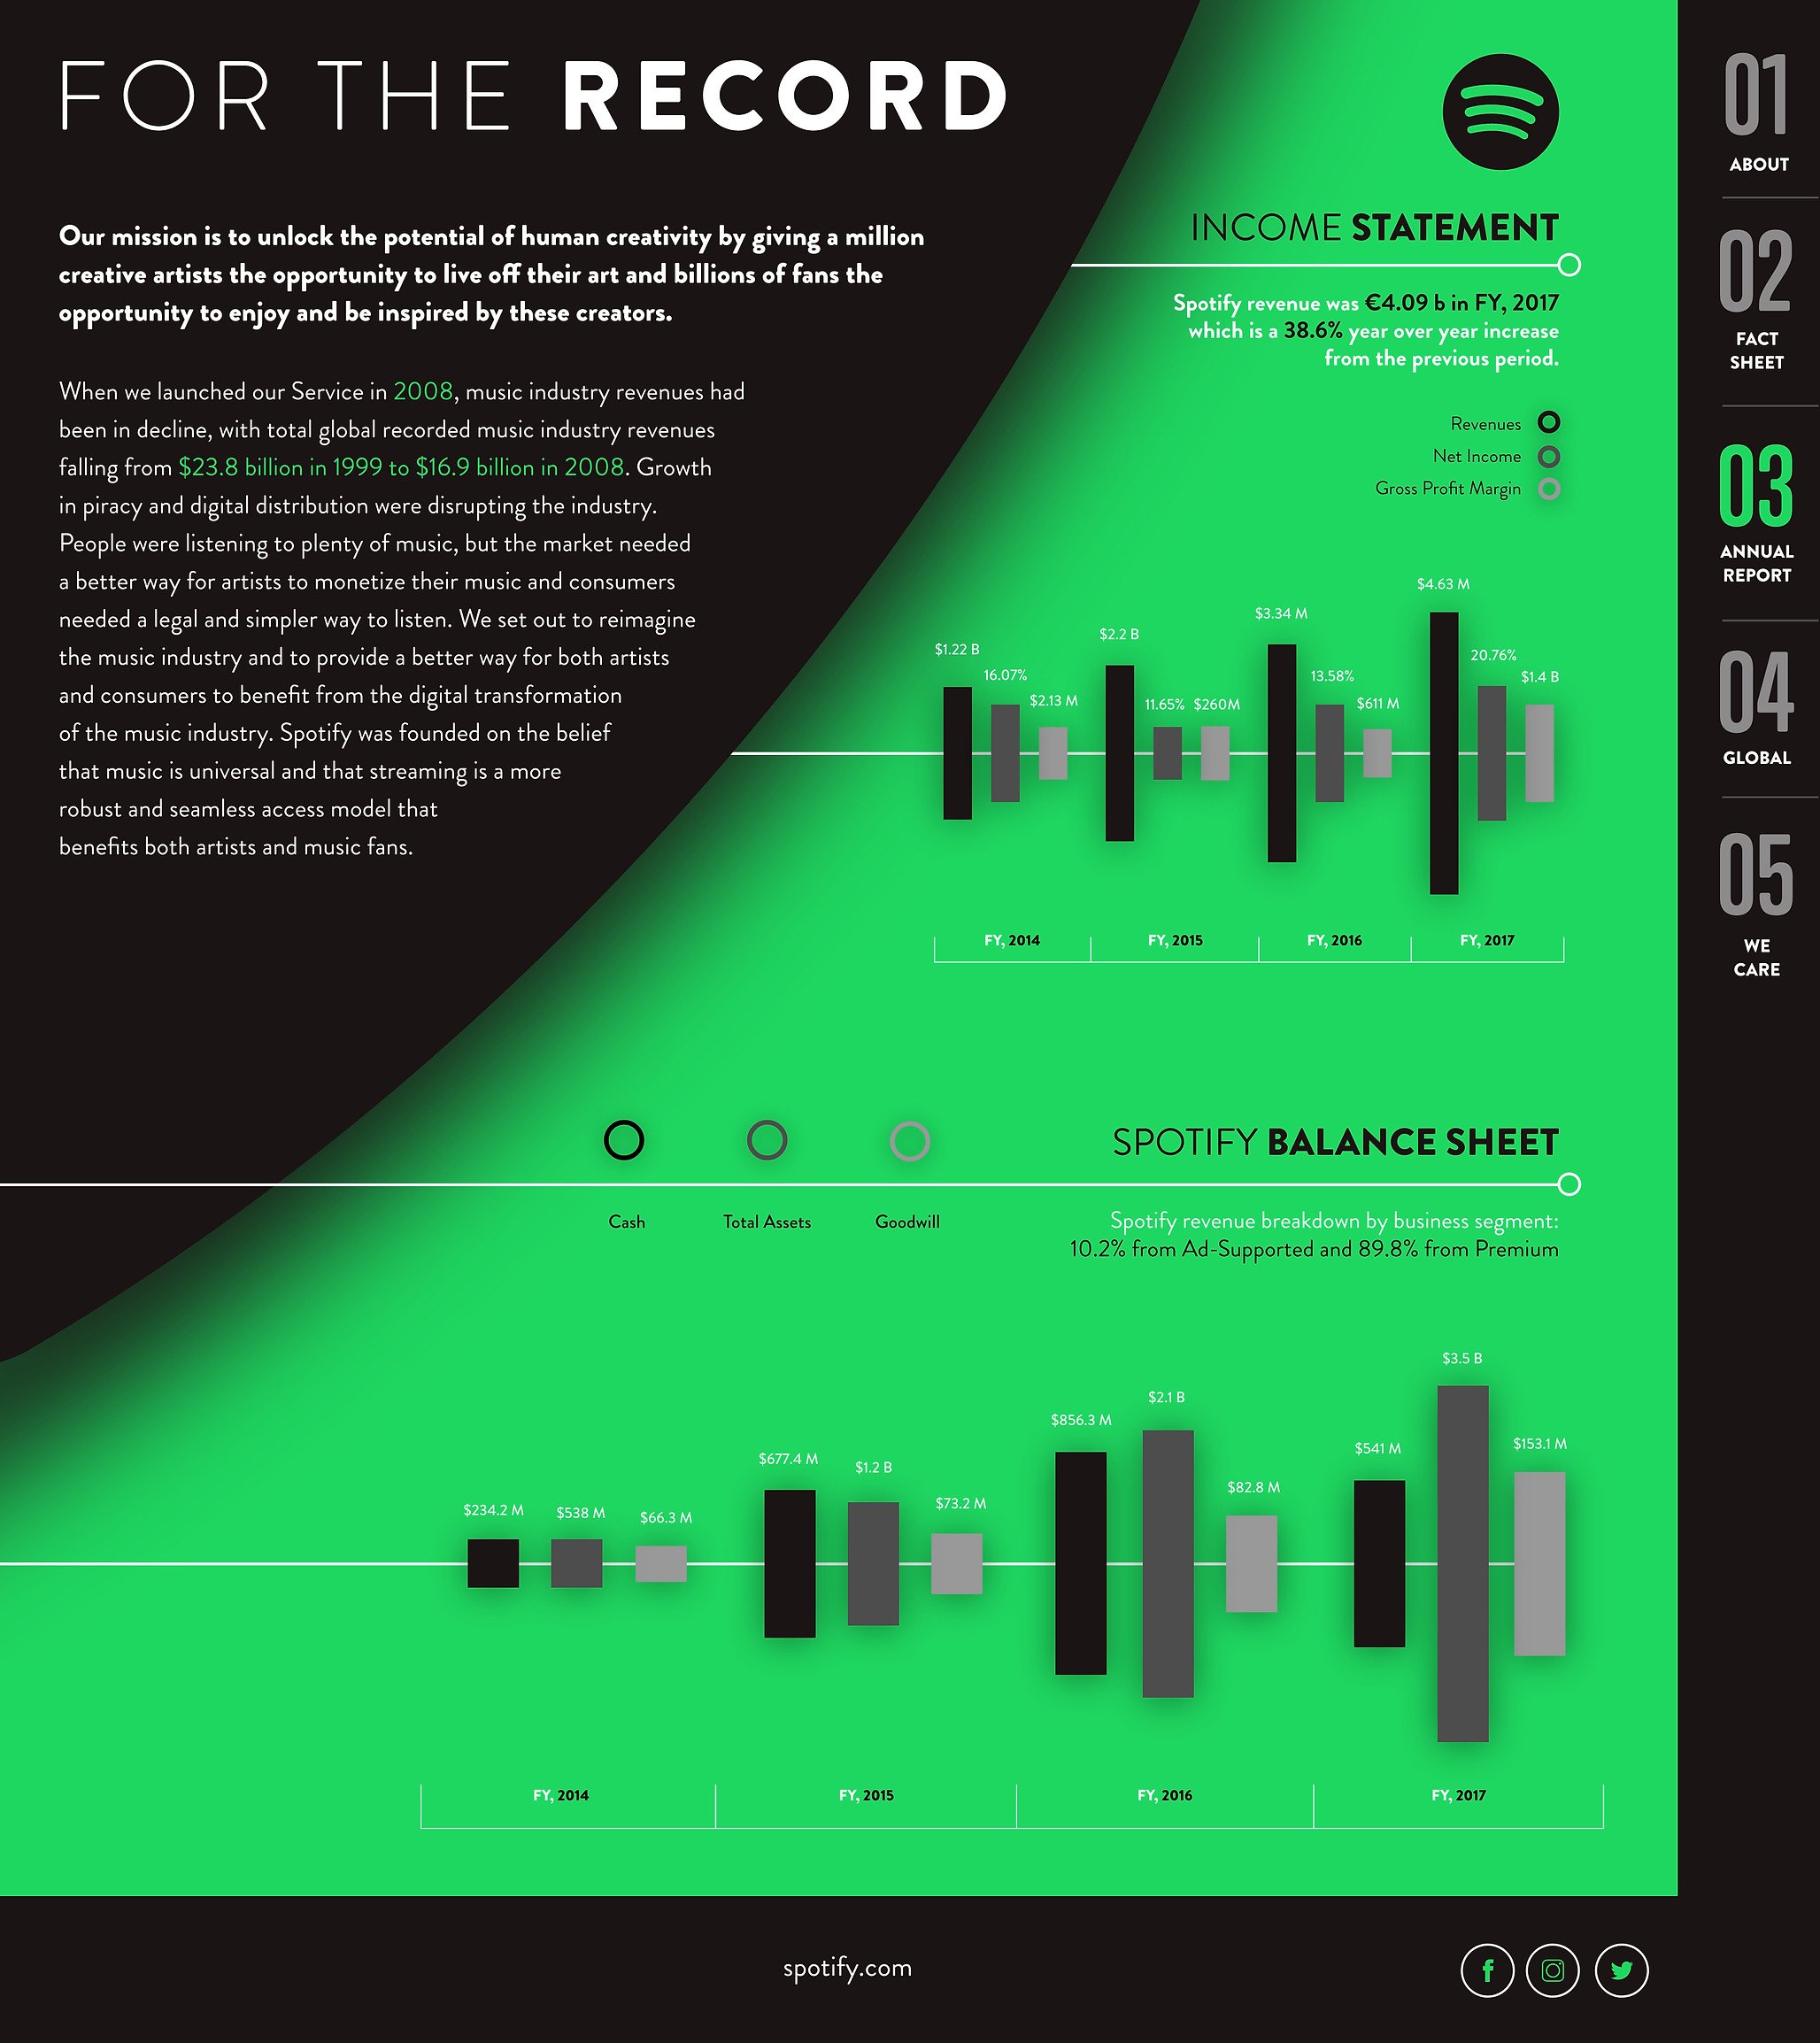
“For the record”: the income statement and balance sheet as two rows of black and grey bar charts on green, with the mission text in a black arc at the top left
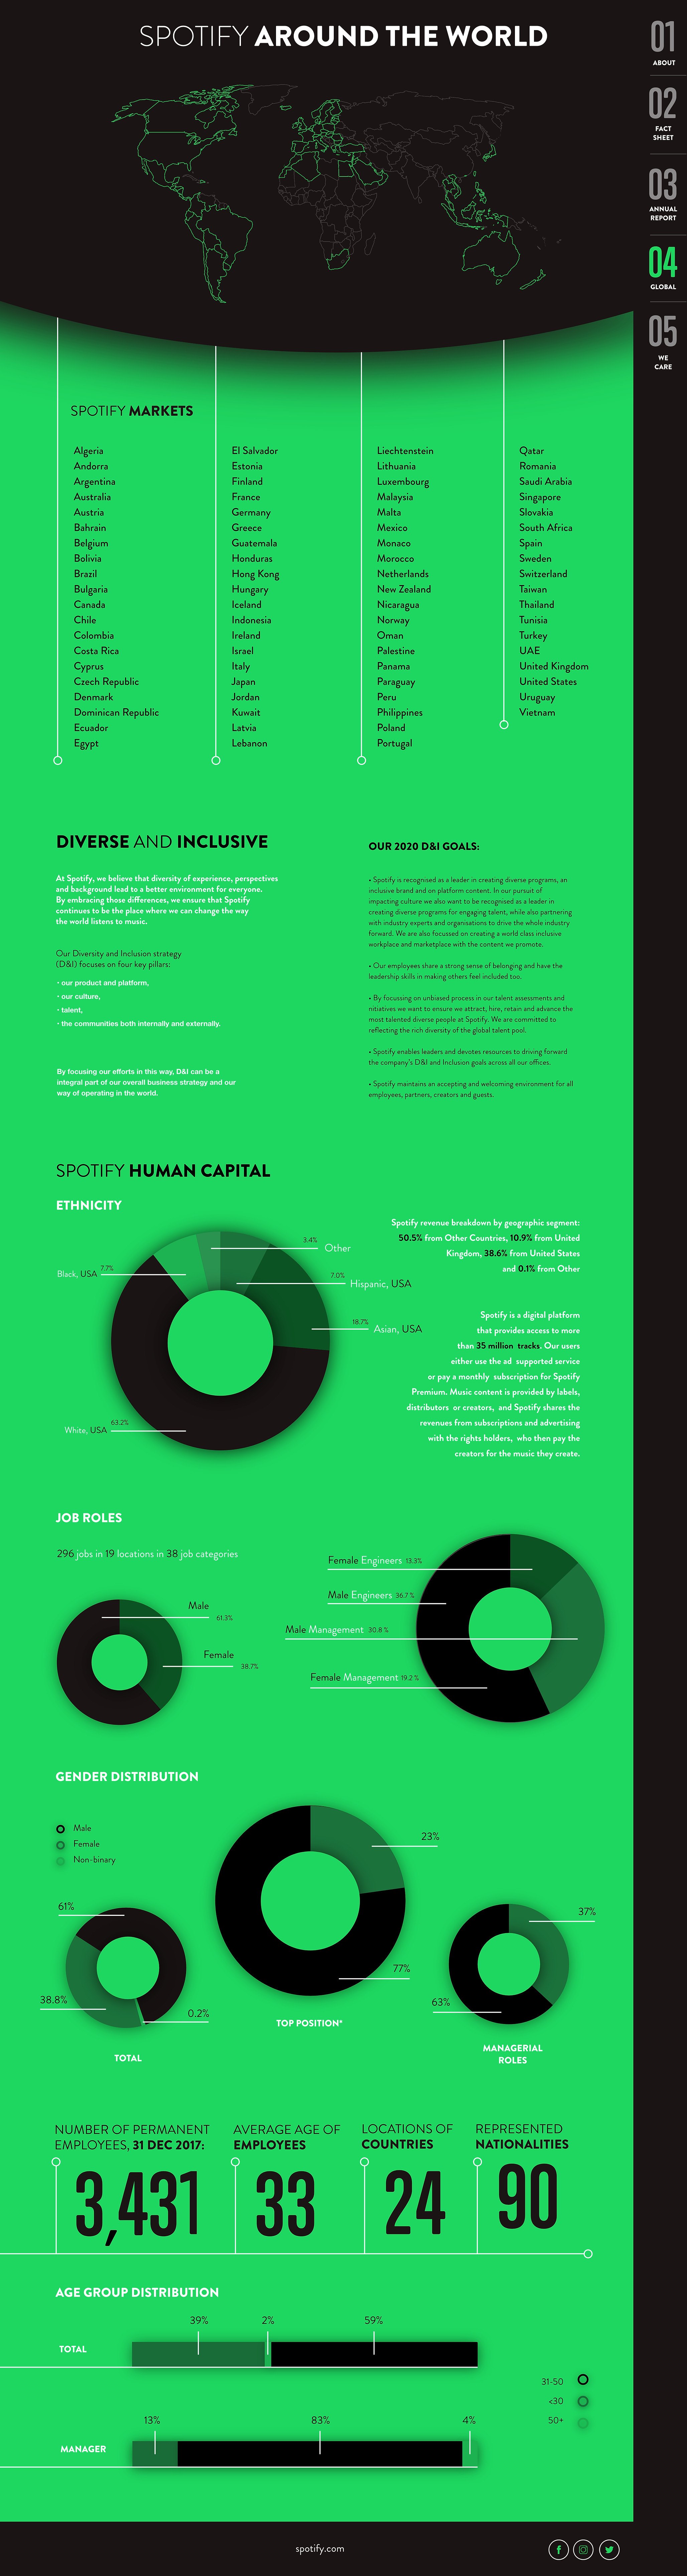
“Spotify around the world”: a dotted world map, four columns listing every market, then diversity and inclusion targets and three donut charts breaking down ethnicity, job roles and gender
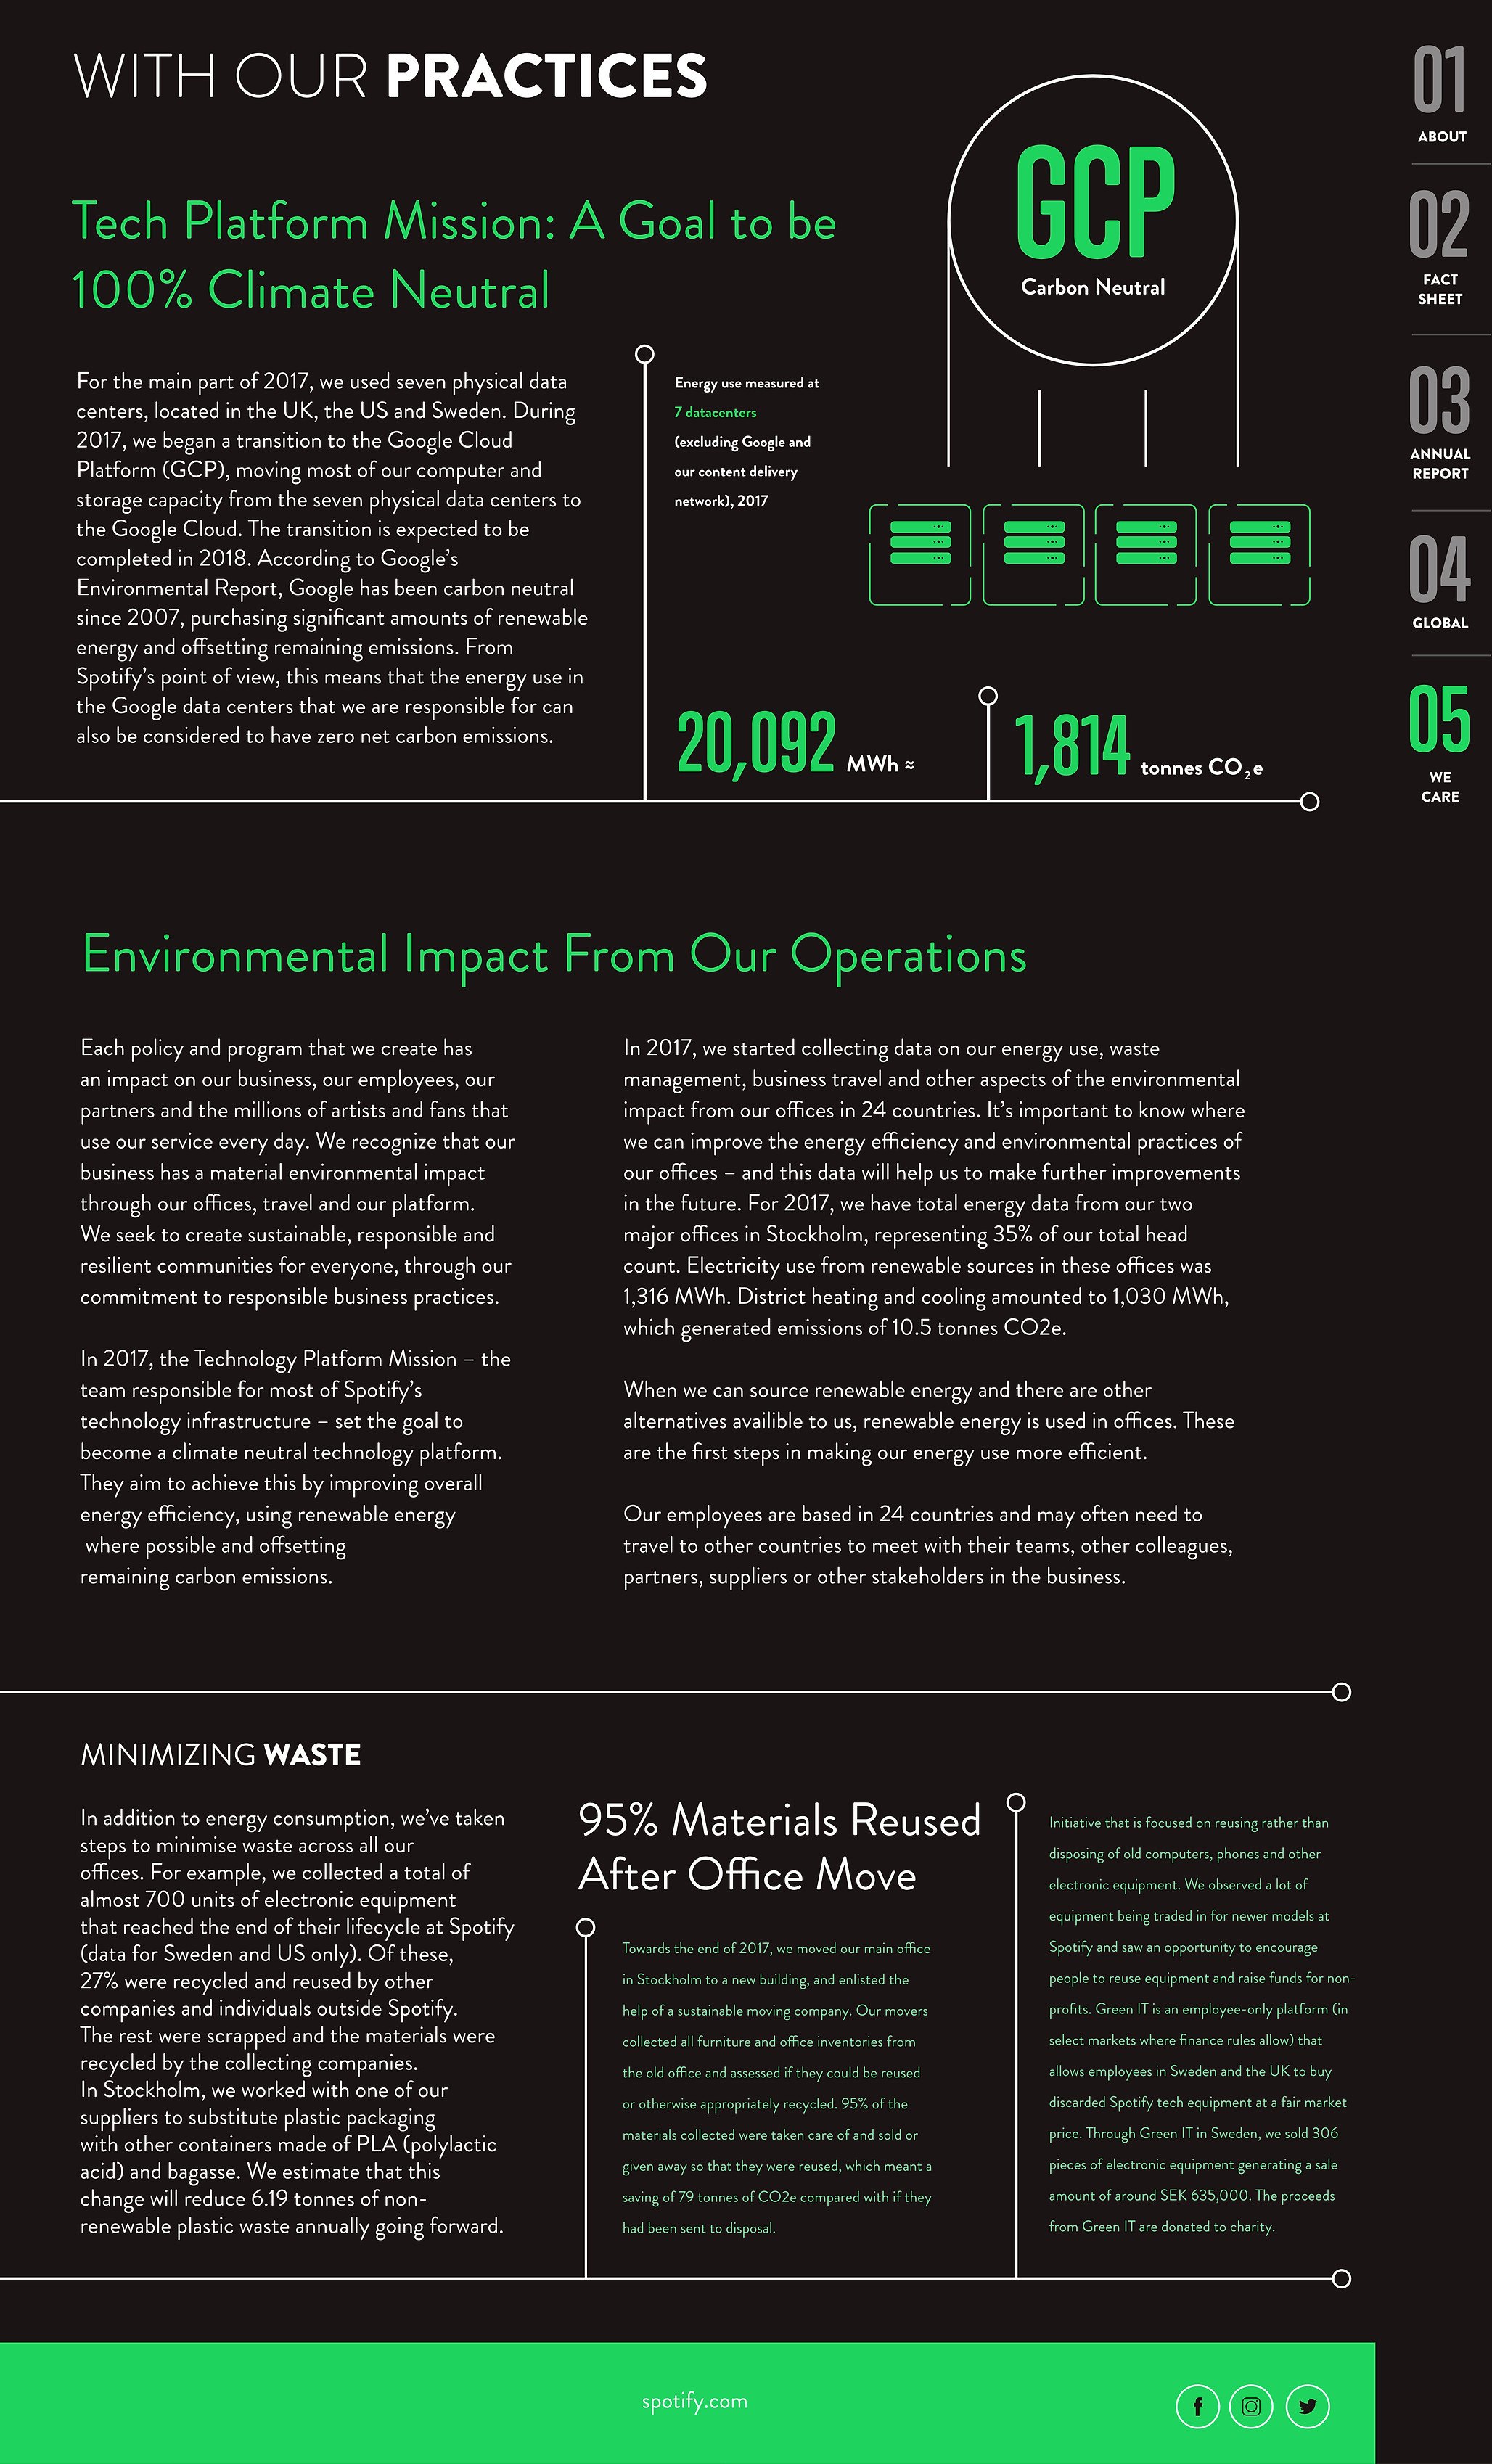
“With our practices”: the carbon-neutral tech platform mission beside a GCP diagram, the environmental impact figures, and a “95% materials reused after office move” panel